CSV to Insights Dashboard — Data Analysis + Automated Reporting

About this Gig
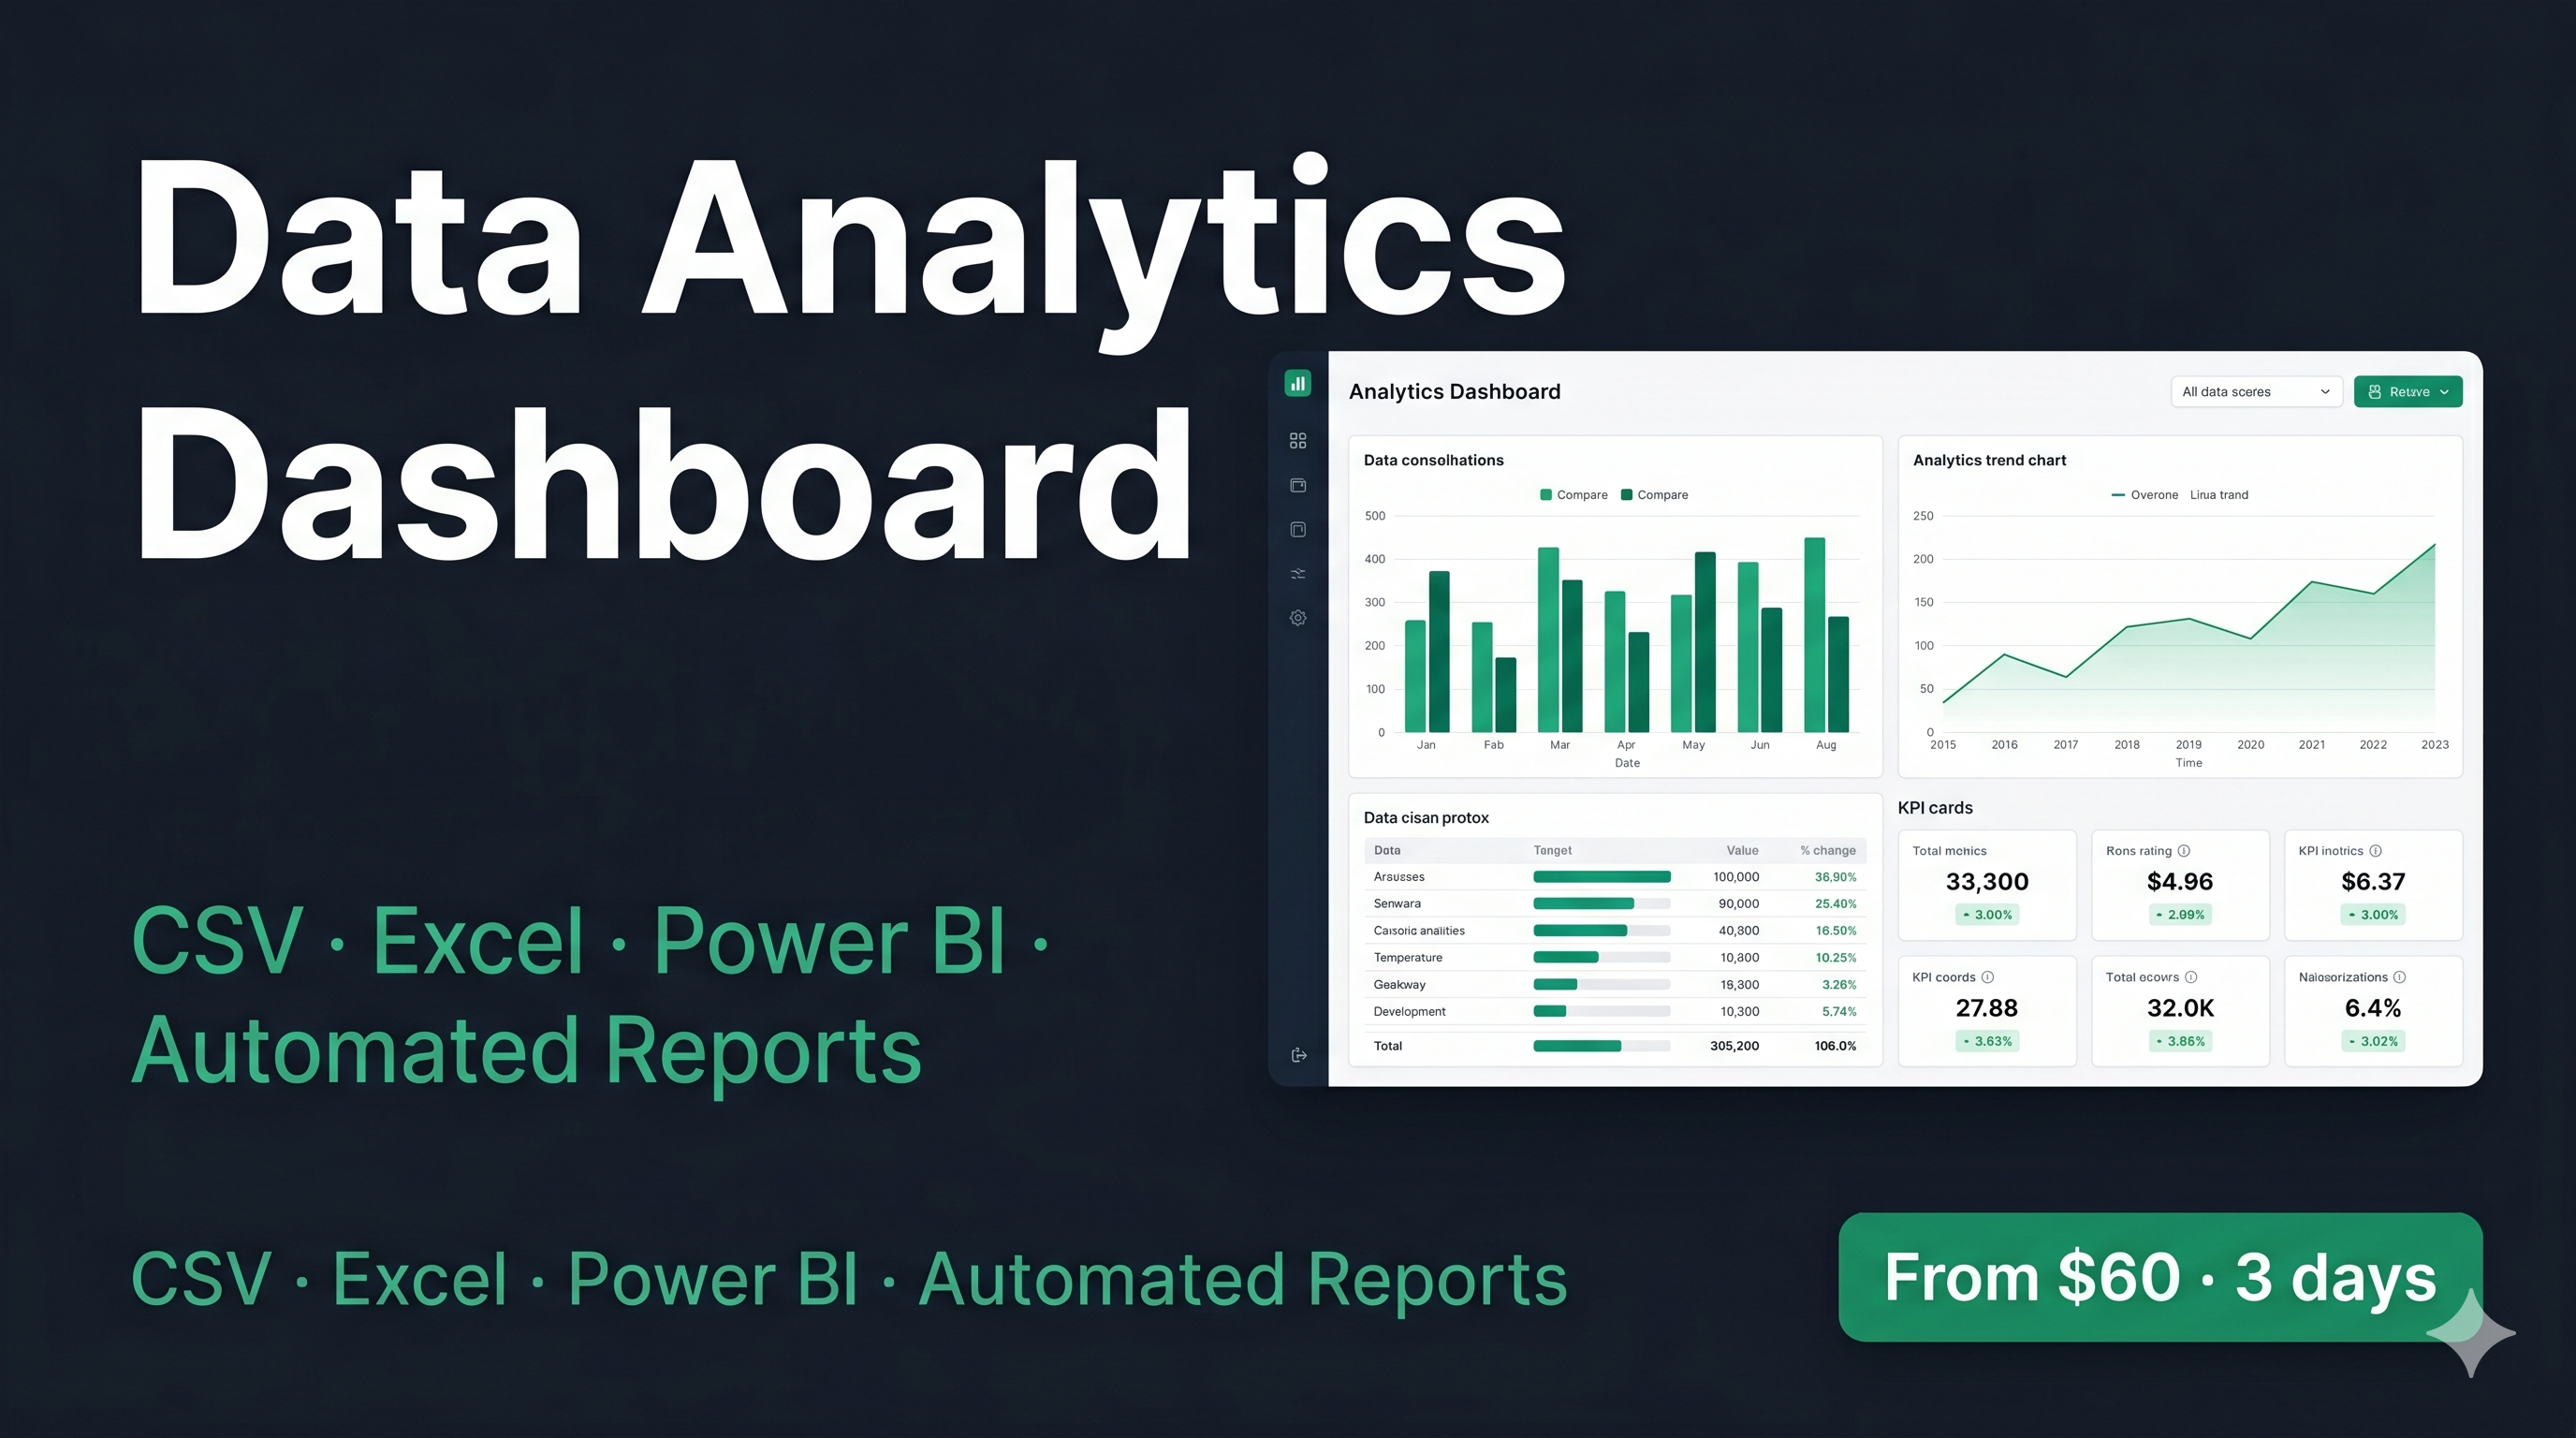
If you're still running reports by hand — pulling files, copying numbers, formatting slides — that's fixable. I'm an economist by training. I've been working with data for 4 years : Excel, Python, SPSS, SQL. I know what the numbers mean, not just how to chart them. What I deliver: - Full analysis report with trends, correlations, and outliers — written in plain language - Interactive dashboard with filters and KPIs (Excel, Power BI, or browser-based) - Automated pipeline: runs weekly or monthly, sends the report without you touching anything - PDF or CSV export Packages: - Starter ($60): Up to 1000 rows, PDF report + 3 charts + written summary — 2-3 days - Pro ($150): Full dashboard (Excel/Power BI) + n8n automation + KPI tracking — 5 days - Enterprise ($350): Complete pipeline + dashboard + monthly automation + training walkthrough — 1 week My own reporting used to take 4 hours a week. After automation: 15 minutes. My public dashboard (DataLens) is live — you can drop your CSV and see what I build before hiring me. Academic peer review: 83/100 on an econometric study of currency movements. 7 days support. Fixes included within scope.

Requirements
1. Your data file (CSV, Excel — a sample or anonymized version is fine) 2. The questions the dashboard should answer (sales trends? churn? which products? which period?) 3. The metrics you track and care about most 4. Preferred output: Excel dashboard, web app, PDF report, Power BI 5. If automation is needed: how often (weekly, monthly) and where the report should land (email, Slack, Drive…)
Related Tags
Get To Know Sidney Branly RABEHAMINA
